Fig. 5.
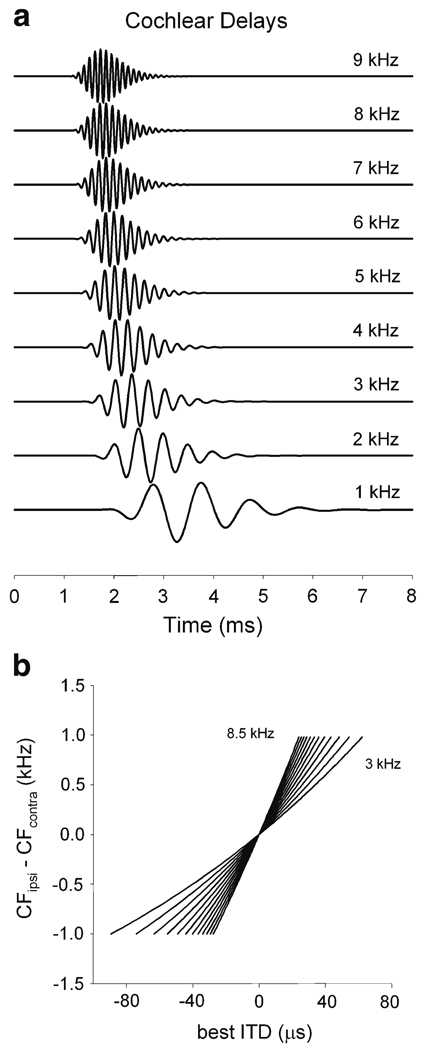
Cochlear delays. Estimates were computed from frequency-dependent latencies of primary auditory fibers of barn owls (reported for group delays in Köppl (1997), in conjunction with the cochlear model of Carney and Yin (1988). a The cochlear delay changes as a function of BF (indicated for each plot). Note that the change in delay is smaller for higher frequencies. b Prediction of how best ITD must change as a function of frequency mismatch and BF using frequency-dependent latencies of primary auditory fibers for the owl (Köppl 1997). BF was changed in steps of 0.5 kHz and is indicated for the lower (3 kHz) and upper (8.5 kHz) limits. Modified from Peña et al. (2001)

