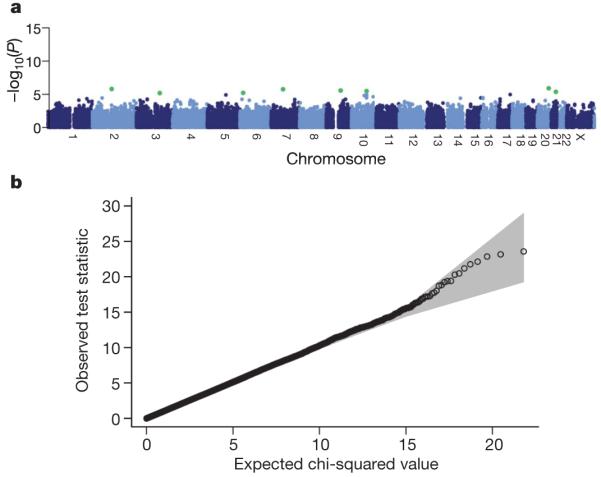
Figure 1. Genome-wide scan for allele frequency differences between controls.

a, P values from the trend test for differences between SNP allele frequencies in the two control groups, stratified by geographical region. SNPs have been excluded on the basis of failure in a test for Hardy-Weinberg equilibrium in either control group considered separately, a low call rate, or if minor allele frequency is less than 1%, but not on the basis of a difference between control groups. Green dots indicate SNPs with a P value <1×10⁻⁵. b, Quantile-quantile plots of these test statistics. In this and subsequent quantile-quantile plots, the shaded region is the 95% concentration band (see Methods).
