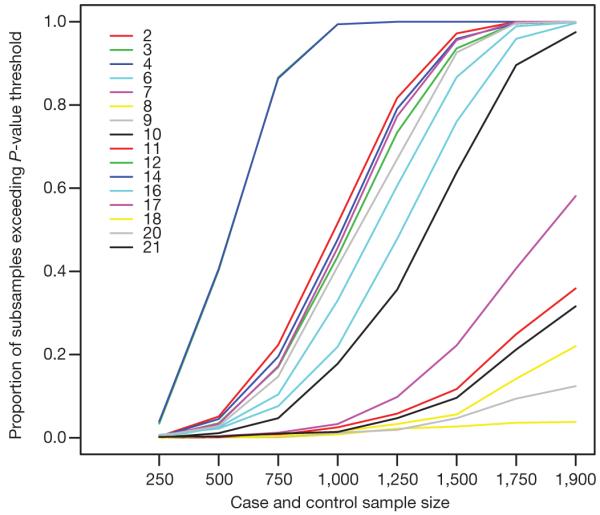
Figure 6. Strong associations in subsamples of our data.

For the 16 SNPs in Table 3 (outside the MHC) with P values for the trend test below 5×10⁻⁷ we randomly generated 1,000 subsets of our full data set corresponding to case-control studies with different numbers of cases, and the same number of controls (x axis). The y axis gives the proportion of subsamples of a given size in which that SNP achieved a P value for the trend test below 5×10⁻⁷. SNPs are numbered according to the row in which they occur in Table 3 (so that, for example, the CAD hit is numbered 2, and the TCF7L2 hit on chromosome 10 for T2D is numbered 20).
