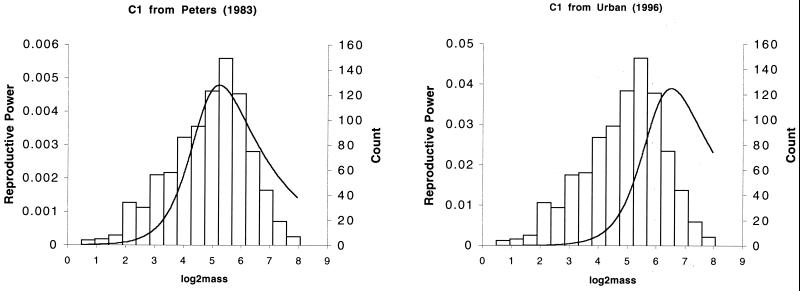
Figure 4.
A comparison of the shapes of SFDs predicted by the BMT model (line) and the empirical SFD (histogram) for all of the bivalve species used in this study. The predicted curve in Left is derived by using parameter estimates from Peters (ref. 1; see text) whereas that in Right is based on an alternative estimate of the same parameter (see text). Both predicted curves assume the relationship log2[(length)1/2 × height] = 5.507 + 0.316 × log2(mass). Note that both predicted and empirical distributions are left-skewed and the predicted mode is close to the observed one. Similar results were obtained for individual provinces (not shown).

