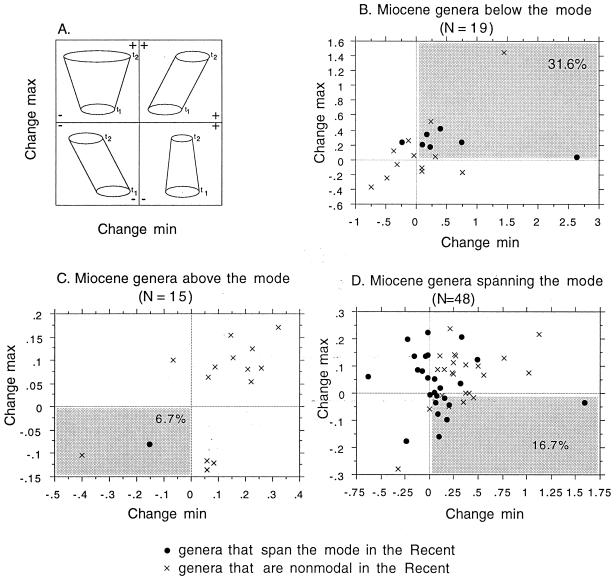
Figure 5.
Evolutionary size change in 82 Miocene–Recent genera and subgenera of bivalves, with each quadrant representing a different evolutionary pattern as diagrammed in A; the shaded quadrants represent those that would be most heavily occupied if the modal size was an evolutionary attractor. (A) Graphical representation of four potential patterns of body-size evolution, from an earlier t1 to a later t2. As in Jablonski (24), the vertical axis is the change in the upper bound of the size distribution of species in a lineage, and the horizontal axis is the change in the lower bound of the size distribution, so that each clade is plotted as a point determined by the behavior of its upper and lower bounds. (B) Temporal changes in genera whose Miocene maximum size was smaller than the present-day (and Miocene) modal class; the shaded quadrant represents the directional size increase toward the modal class, the expectation if the mode was an evolutionary attractor. (C) Temporal changes in genera whose Miocene minimum size was greater than the modal size class; the shaded quadrant represents directional size decrease toward the modal class. (D) Temporal changes in genera whose size range spanned the modal size class during the Miocene; the shaded quadrant represents a narrowing of size ranges around the mode.

