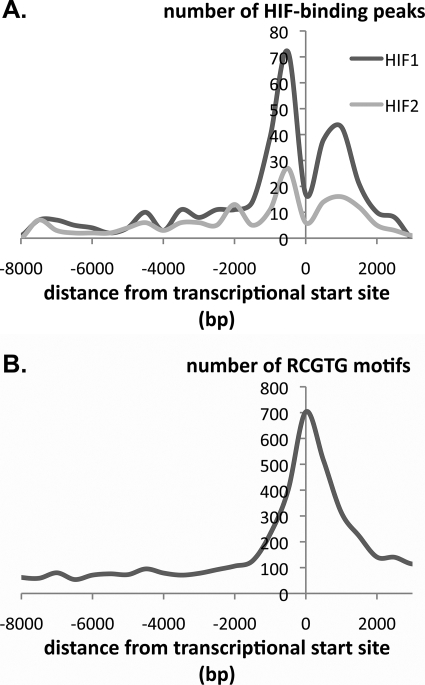
FIGURE 2.
Distribution of HIF-1α- and HIF-2α-binding sites. A, distribution of high stringency (MA score >4) HIF-1α- and HIF-2α-binding sites referred to the nearest transcriptional start site. Number of HIF-binding peaks expressed per 500-bp bin is shown. B, frequency distribution of RCGTG motifs at gene loci that bind HIF-1α or HIF-2α. The number of RCGTG motifs expressed per 500-bp bin is shown.

