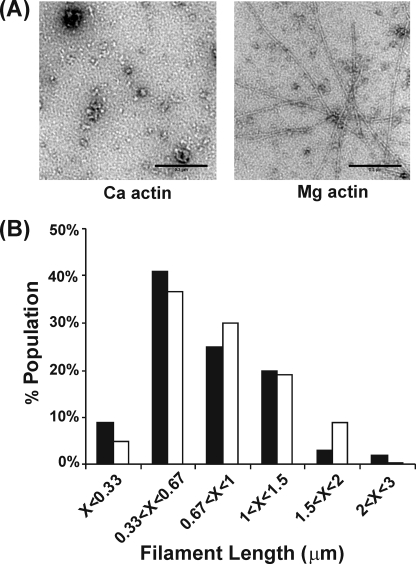
FIGURE 2.
Electron microscopic analysis of the structure and length of the Bnr1/G-actin complex. Panel A, either 1 μm Ca- or Mg-G-actin was mixed with 1 μm Bnr1 in either Ca- or Mg-G-buffer, respectively, at room temperature for 15 min, and the samples from each reaction were observed by EM as described under “Experimental Procedures.” Bar = 0.2 μm. Panel B, distribution of filament length in the reaction of 1 μm Mg-G-actin with Bnr1 (solid column: 0.1 μm, and open column: 1 μm) were determined by measuring at least 100 filaments per sample by ImageJ (NIH), and the distribution of filament length was analyzed with Excel (Microsoft).

