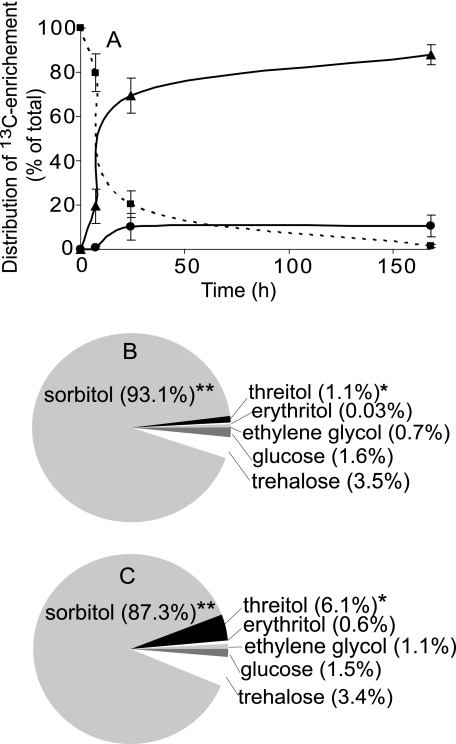
FIGURE 3.
Metabolic fate in vivo of 13C arising from singly labeled glucose isotopomers. A, time course showing metabolism of 13C-enriched glucose isotopomers over 168 h at −4 °C: glucose (squares), sorbitol (triangles), and all remaining saccharides (circles). The relative contribution of each saccharide to the 13C pool was calculated by integrating all signals within a spectrum. Signal integrals from a given molecule were compared with determine how much a specific site within the molecule (e.g. C-1, C-2, etc.) was enriched above natural abundance. This was not possible for ethylene glycol because it exhibits only one signal; thus, the enrichment was estimated based on the ratio of enriched to natural abundance threitol signals. The enrichment of individual saccharides, usually in terms of a standardized signal area, was then summed across saccharides to determine the proportional contribution of each. B and C, the proportion of the total 13C enrichment represented by a given saccharide at 168 h after the injection of singly labeled glucose 13C-labeled isotopomers labeled at C-1—C-2 (B) and C-3—C-6 (C). Asterisks indicate saccharides that comprised significantly different (p < 0.05, Student's t test, n = 10) proportions of the total 13C pool with the injection of C-1—C-2 versus C-3—C-6 glucose 13C-labeled isotopomers.

