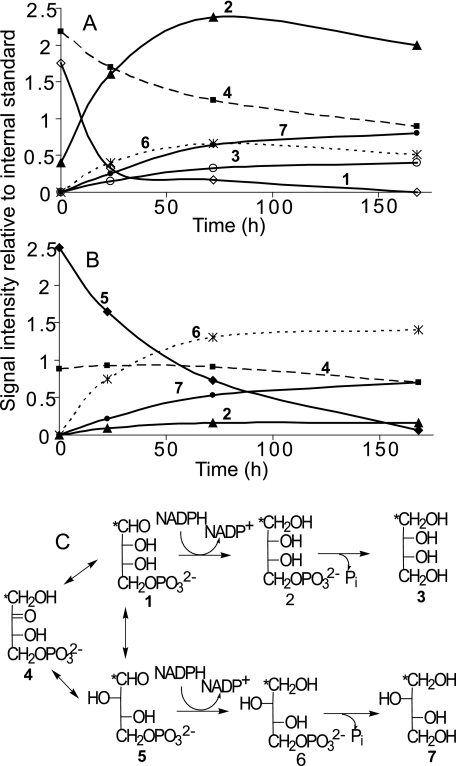
FIGURE 6.
In vitro metabolism at −2.5 °C of putative intermediates in threitol biosynthesis. A and B, time course of signal intensities (relative to the internal standard) arising from in vitro metabolism of d-[1-13C]E4P (A) and d-[1-13C]T4P (B). The concentration of the internal standard was ∼2-fold higher in the T4P samples (relative to E4P samples), and both aldose phosphate stock solutions contained Eu4P arising from nonenzymatic isomerization prior to their addition to the homogenate. Only the total intensity of the erythritol and threitol signals was known at 24 h because the spectra were collected at −1 °C and their signals were coincident. Thus, the relative intensities at 24 h are estimates based on the total intensity. Subsequent spectra were collected at 22 °C, where the signals were well resolved. The number on each curve corresponds to a structure in the metabolic scheme (C). An asterisk indicates the site of 13C enrichment. Assignments are as follows: open diamonds, d-[1-13C]E4P (1); closed triangles, d-[1-13C]erythritol 4-phosphate (2); open circles, d-[1-13C]erythritol (3); closed squares, d-[1-13C]Eu4P (4); closed diamonds, d-[1-13C]T4P (5); asterisks, d-[1-13C]threitol 4-phosphate (6); closed circles, d-[1-13C]threitol (7).

