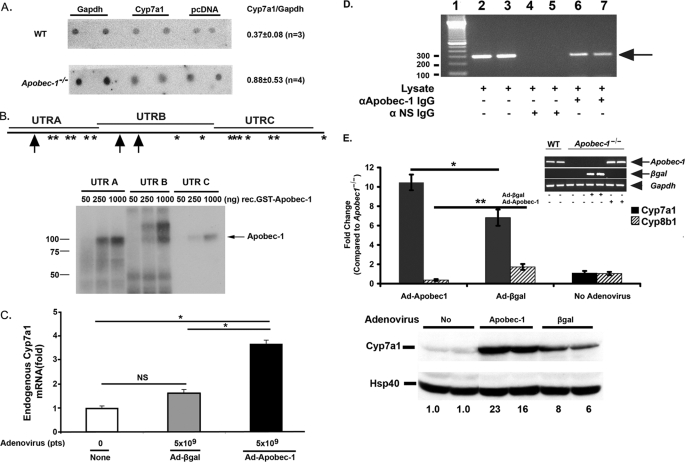
FIGURE 7.
Apobec-1-dependent modulation of Cyp7a1 gene expression. A, nuclear run-on assays show similar Cyp7a1 transcription rate in Apobec-1−/− and WT mice. Isolated nuclei were prepared from two separate groups (n = 4 or 5 mice/group for each experiment) of WT and Apobec-1−/− mice and run-on transcripts hybridized to immobilized DNA encoding Gapdh, Cyp7a1, or pcDNA3.1 for background control. Radiolabeled nascent RNA hybridizing to Cyp7a1 versus Gapdh was determined by phosphorimaging and corrected for background control. The data are derived from 3–4 independent experiments from mice of the indicated genotype. The quantitation is indicated on the right as the mean ± S.E. B, top, distribution of Apobec-1 binding sites UUUN(A/U)U in Cyp7a1 3′-UTR is shown. Schematic representation of Apobec-1 binding motif in 3′-UTR of murine Cyp7a1. *, single copy APOBEC-1 binding motif. Arrow, two tandem repeats of APOBEC-1 binding motif. Cyp7a1 3′-UTR was divided into three different fragments (UTRA, UTRB, and UTRC) whose coordinates are detailed under “Materials and Methods.” Bottom, UV-cross-linking assays were performed with radiolabeled cRNA (UTRA, UTRB, or UTRC) and 50–1000 ng of glutathione S-transferase-APOBEC-1. Molecular mass makers are shown on the left. The arrow indicates the cross-linked bands. C, Apobec-1 transfection increases endogenous Cyp7a1 mRNA expression in HepG2 cells. HepG2 cells were infected with 5 × 10⁹ particles (pts) of Ad-β-galactosidase or Ad-Apobec-1 for 48 h. Cyp7a1 mRNA expression was determined by quantitative PCR. Data are normalized to Cyp7a1 mRNA expression in noninfected HepG2 cells. Bar graphs represent the mean ± S.E. from 2–4 independent assays. *, p < 0.05 in the groups of transduced and untransduced HepG2 cells. D, Cyp7a1 mRNA can be coimmunoprecipitated with anti-APOBEC-1 IgG. Liver lysates were freshly prepared from Apobec-1−/− mice following infection with Ad-Apobec-1 and immunoprecipitated with anti-APOBEC-1 IgG or control IgG. RNA was extracted from the immune pellet (or input lysate in lanes 2 and 3) and subjected to reverse transcription-PCR with primers specific to Cyp7a1. The arrow indicates the Cyp7a1 amplified bands. Molecular mass makers are shown on the left. NS, nonspecific IgG. E, hepatic Cyp7a1 mRNA expression (top) and protein expression (bottom) in Apobec-1−/− mice was increased by Ad-Apobec-1 infection. By contrast, Ad-Apobec-1 infection decreased Cyp8b1 mRNA expression in Apobec1−/− mice. Relative expression of hepatic Cyp7a1 and Cyp8b1 mRNA was analyzed by qRT-PCR. Data are normalized to hepatic Cyp7a1 or Cyp8b1 expression of Apobec-1−/− mice without adenovirus infection. Bar graphs show mean ± S.E., 5 mice/group. Filled bar, Cyp7a1; hatched bar, Cyp8b1. The inset images confirm comparable Apobec-1 mRNA expression (reverse transcription-PCR) following Ad-Apobec-1 delivery or of β-galactosidase mRNA expression following Ad-β-galactosidase delivery into Apobec-1−/− liver. The arrows indicate Apobec-1 or β-galactosidase-specific RT-PCR products, and the arrowhead indicates Gapdh-specific RT-PCR product. *, p < 0.05; **, p < 0.01. Hepatic CYP7A1 protein expression was analyzed by Western blot and quantitated by imaging, with HSP40 used as a loading control. The numbers below each lane indicate relative abundance of CYP7A1 after normalizing expression to uninfected Apobec-1−/− mice (no adenovirus) as 1.

