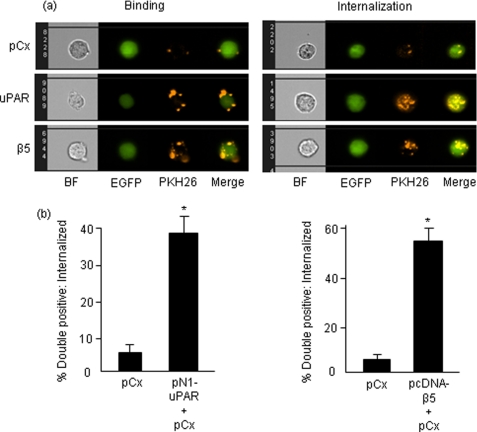
FIGURE 2.
Analysis of phagocytosis by Amnis ImageStream System - Comparison of binding versus internalization. a, output images after Amnis acquisition. CS-1 cells were transiently transfected as shown in the figure and co-cultured with apoptotic cells for 2 h. Panels on the left depict peripheral binding of apoptotic components. Right panels were obtained after subtraction of two peripheral green pixels from phagocytes and depict internalized apoptotic material. BF, brightfield. b, quantification of internalized apoptotic material. Note that quantification does not include peripheral binding values and only represent phagocytes that have completely engulfed apoptotic bodies. Asterisk, p < 0.05.

