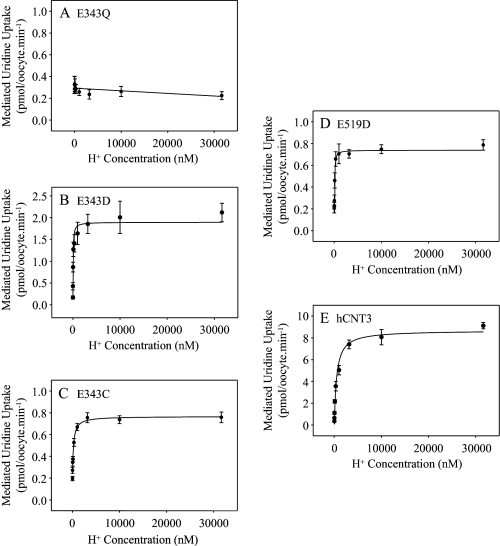
FIGURE 8.
H+-activation kinetics of hCNT3 and mutants. H+-activation curves for oocytes producing E343Q (A), E343D (B), E343C (C), E519D (D), or hCNT3 (E) were measured in transport medium containing 100 mm ChCl transport medium with pH values ranging from 4.5 to 8.5 (H+ concentration 31.6 μm and 3.16 nm, respectively). The concentration of radiolabeled uridine was 20 μm. Values were corrected for basal nonmediated uptake in control water-injected oocytes and are means ± S.E. of 10–12 oocytes. Kinetic parameters calculated from the data are presented in Table 3.

