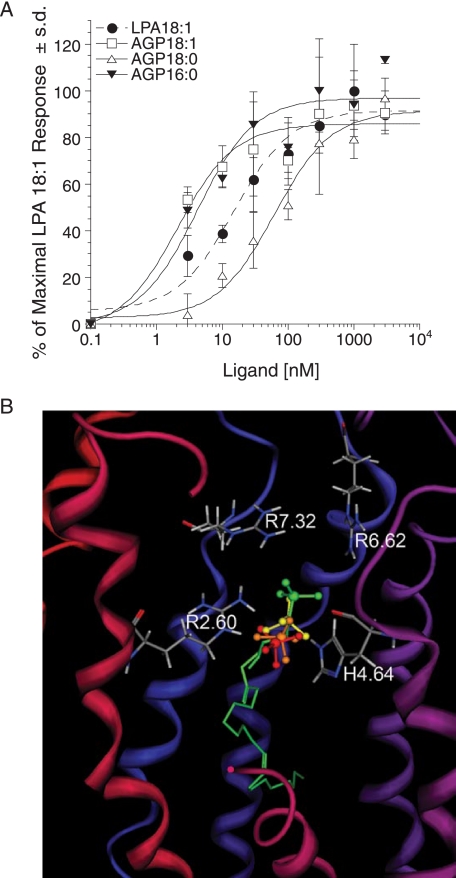
FIGURE 6.
SAR for 1-alkyl-LPA analogs at LPA5 and model of the receptor-ligand complexes. A, intracellular Ca2+ transients were measured in response to different 1-alkyl-LPA species in RH7777 cells transiently expressing LPA5. 100% represents the maximal response to LPA 18:1. Samples were run in triplicate, and the mean ± S.D. was plotted. B, comparison of docked phosphate headgroups for LPA 18:1 (green) and AGP species (yellow, 18:1; orange, 16:0; red, 18:0).

