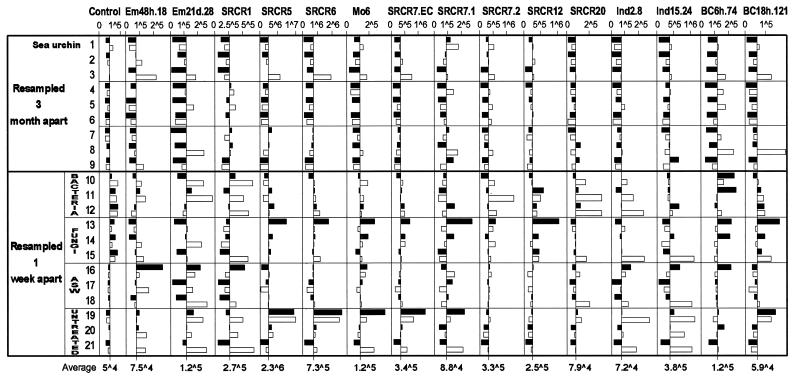
Figure 5.
Graphic presentation of hybridization values for 16 SRCR gene markers in repeated samples from 21 sea urchins (black bar for the first sample, white for the second). Data bars represent distance from the average value calculated for that marker (x axis crosses at the average value, which is shown at the bottom). Nine sea urchins were each sampled twice 3 months apart (nos. 1–9). Another group of 12 sea urchins were sampled before, and 1 week after treatment. The coelomic cavities of these animals were injected with 1 ml of OD600 = 1 of live sea urchin surface bacteria (nos. 10–12) or with 1 ml of OD600 = 1 of live sea urchin surface fungi (nos. 14–16) or with 1 ml of artificial seawater (ASW; nos. 17–19), and three animals were untreated (nos. 19–21). Arbitrary PhosphorImager values of hybridization are shown for markers representing SRCR types 1, 5, 6, 7, 12, and 20, the two C-terminal variants of SpSRCR7, and seven incomplete previously unknown sequences. Control, hybridization values for SRCR marker BC12h.77 that show little variation in gene expression. In the numerical values, ∧ represents exponent of 10.

