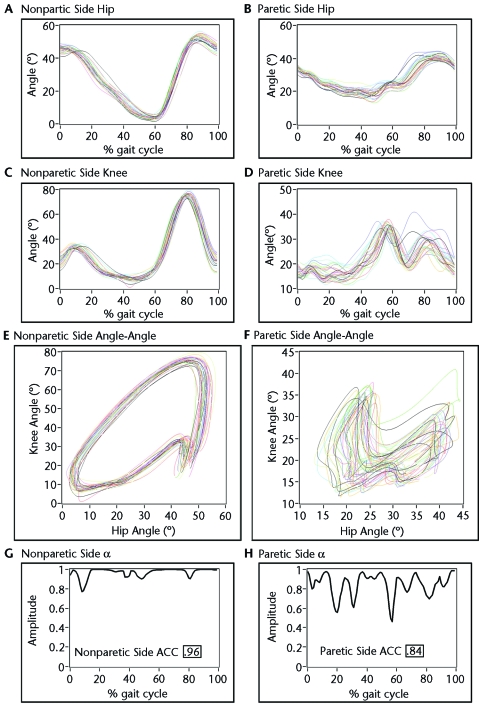
Figure 2.
Representative example of data obtained before locomotor training (LT) for a participant enrolled in the robotic-assisted LT group. The left column represents the nonparetic-side hip (A) and knee (C) angles plotted against percentage of gait cycle for all steps, with an angle-angle plot for the hip and knee (E). The bottom graph represents the a values calculated for each percentage of the stride cycle, with the hip and knee average coefficient of correspondence (ACC) value (G). Similarly, the right column shows the more-variable paretic-side hip (B) and knee (D) angles with the respective angle-angle plot (F) and a values (H) used to calculate hip and knee ACC.

