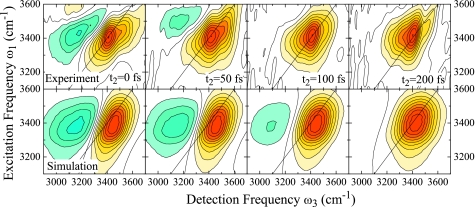
Figure 8.
2DIR correlation spectra of the OH stretching vibration in H2O for population times t2=0, 50, 100, and 200 fs. Top panel: experimental data (Ref. 26), bottom panel: κ=12 cm−1 corrected for experimental pulse spectrum and ad hoc population relaxation, see text. Each spectrum is normalized to its maximum. Figure adapted from Ref. 28.

