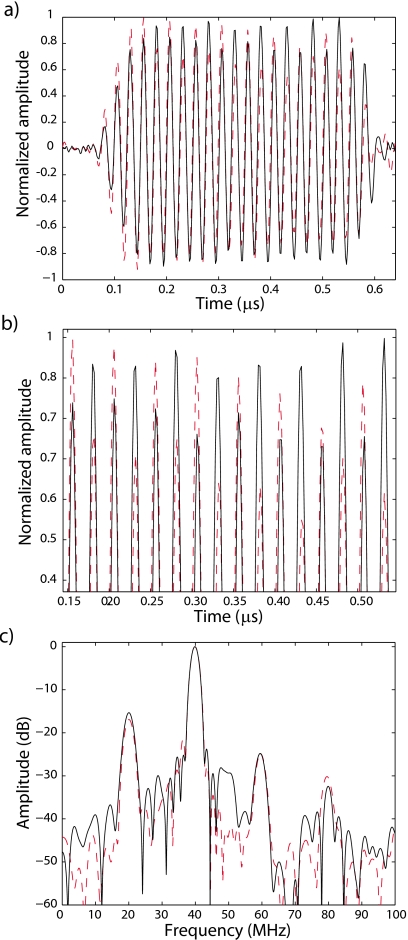
Figure 10.
Illustration of positive and negative subharmonic events. (a) Time waveform of the most-positive (dash) and most-negative (solid) subharmonic events of a 1000-event data set obtained with 20-cycle excitation and a peak-rarefactional pressure of 2.1 MPa. (b) Magnified version of (a). (c) Spectra of the most-positive (dash) and most-negative (solid) subharmonic events.

