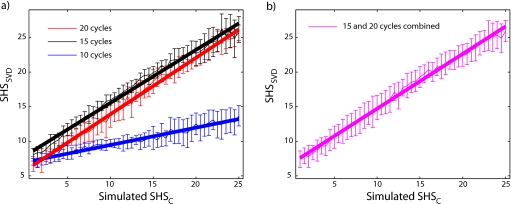
Figure 8.
Empirical-simulation results: (a) SHSSVD as a function of simulated SHSC for 10-, 15-, and 20-cycle excitations. Each data-point is the mean of 20 simulations, and error bars represent standard deviations. (b) SHSSVD as a function of simulated SHSC for combined 15- and 20-cycle excitations. Each data-point is the mean of 40 simulations (20 with 15-cycle excitation and 20 with 20-cycle excitation). Bold lines represent least-squares straight-line fits to the results.

