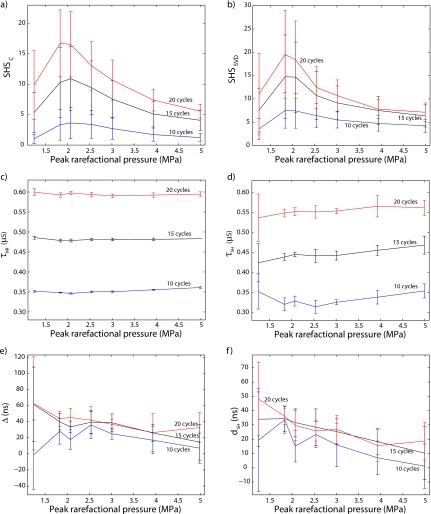
Figure 9.
Conventional- and SVD-method results. In all the panels, data-points are the means and error bars represent standard deviations. Results are presented as a function of peak-rarefactional pressure for 10-, 15-, and 20-cycle excitations. (a) SHSC and (b) SHSSVD. (c) τNR and (d) τSH. (e) Δ and (f) dSH.

