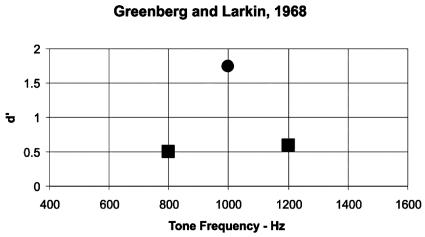
Figure 2.
Data from Greenberg and Larkin (1968) showing d′ as a function of tone frequency in Hz. The circled point at 1000 Hz is the test signal, and the d′ values for probe tones at 800 and 1200 Hz are shown as squares. Greenberg and Larkin (1968) plotted their data in terms of percent correct. Percent correct was converted to d′ based on assuming a symmetric criterion and using the tables in Swets (1964).

