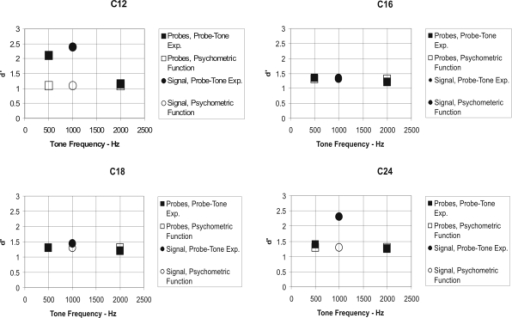
Figure 3.
Probe-tone experimental data for four chinchilla subjects (C12, C16, C18, and C24) showing d′ as a function of tone frequency in Hz. Circled data points at 1000 Hz are for the signal frequency, and the squares are for the 500- and 2000-Hz probe frequencies. Open symbols are for estimates from the psychometric-function baseline experiment, and closed symbols are for the probe-tone test experiment.

