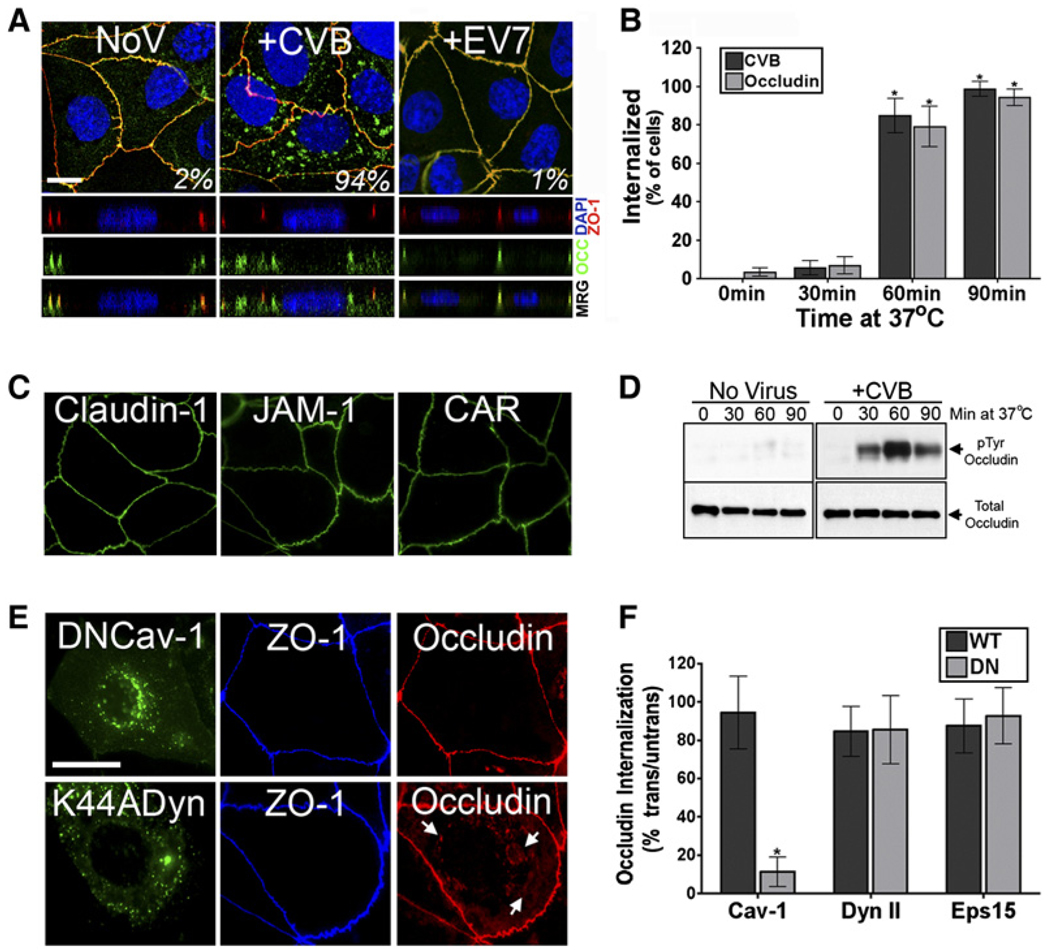
Figure 1. Occludin Is Internalized and Tyrosine Phosphorylated in Response to CVB Entry.
(A) Monolayers exposed to CVB or EV7 (100 PFU/cell) were fixed and stained for ZO-1 (red) and occludin (green) 90 min p.i. Indicated in white is the percentage of total cells containing occludin within the cytoplasm (as determined as described in the Experimental Procedures)
(B) Quantification of the internalization of CVB and occludin at 30, 60, and 90 min p.i. (shown as the percentage of total cells containing CVB and occludin in the cytoplasm).
(C) Monolayers exposed to CVB (100 PFU/cell) were fixed and stained for claudin-1, JAM-1, or CAR at 90 min p.i.
(D) Lysates of monolayers exposed to CVB (100 PFU/cell) for the time indicated were immunoprecipitated with anti-occludin pAb. Immunoprecipitates were immunoblotted with anti-phosphotyrosine 4G10 mAb, stripped, and reprobed with anti-occludin mAb.
(E) Monolayers expressing GFP-tagged dominant-negative (DN) caveolin-1 or HA-tagged dominant-negative dynamin II were exposed to CVB (100 PFU/cell) for 90 min, fixed, and stained for occludin.
(F) Quantification of the effects of wild-type (WT) or dominant-negative caveolin-1 (Cav-1), dynamin II (Dyn II), or Eps15 on occludin internalization. Data are shown as percentage of occludin internalized compared to nontransfected controls. Data are representative of at least three independent experiments performed at least three times. Data in (B) and (F) are presented as means ± standard deviation. *p < 0.05.

