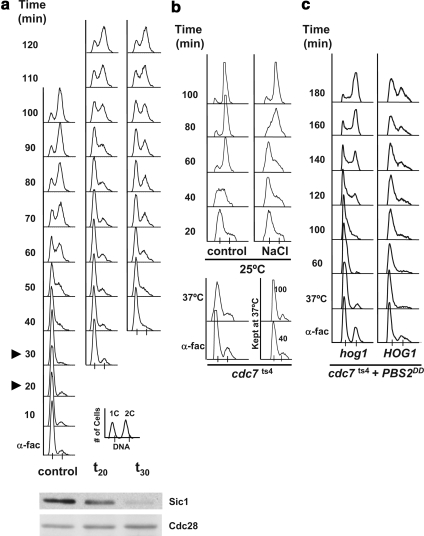
Figure 1.
HOG activation induces an S phase delay. (a) Cells osmostressed in S phase exhibit a distinct cell cycle delay than that in cells stressed in G1. Cells growing exponentially in YPD at 25°C were synchronized in G1 phase with α-factor for 3 h (α-fac), washed of α-factor, and released into fresh YPD medium (control) or subjected to 0.4 M NaCl 20 min (t20) or 30 (t30) min subsequent to release from α-factor, as indicated by the arrowheads in the control cells. Samples were taken every 10 min and assessed for total DNA content by FACS analysis. A key for the FACS profiles is presented at the bottom right corner. A Western blot monitoring Sic1 levels is shown underneath. There the left lane shows the amount of Sic1 just after release from alpha factor, the middle panel shows the amount of Sic1 at time 20 after release, and in the right panel the amount present at time 30. Cdc28 was used as a loading control for the Western blot. (b) Cells delay when osmostressed during S phase. An exponential culture of cdc7ts4 cells grown at 25°C was incubated with α-factor for 3 h (α-fac), washed free of α-factor, and immediately shifted to the nonpermissive temperature of 37°C for 1 h (37°C) to synchronize the cells in S phase. The culture was then shifted back to 25°C (control) and half of the cells were subjected to 0.4 M NaCl (NaCl). Part of the culture was maintained at 37°C throughout the experiment, and samples were taken after 40 and 100 min (kept at 37°C, bottom right-hand side). (c) S phase delay is dependent on HOG1. cdc7ts4 and the isogenic hog1Δ mutant harboring a plasmid bearing the Pbs2DD constitutively active MAPKK under the GAL1 promoter were grown and synchronized as described in b. Cells were grown with raffinose and galactose was added upon shifting the cells to 37°C. Experiments were performed at least twice, and representative results are shown.

