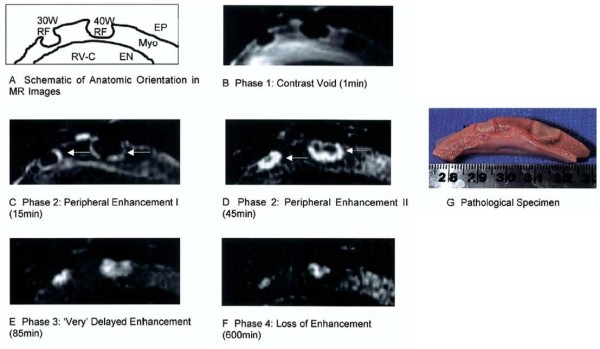
Figure 6.
Example of gadolinium enhanced T1 weighted MR imaging of right ventricular epicardial RF ablation lesions with pathologic correlation. Different lesion enhancement patterns are seen from one minute to 2 hours after contrast injection. Figure included with permission from the Journal of the American College of Cardiology (Dickfeld JACC 2006;47(2):370).

