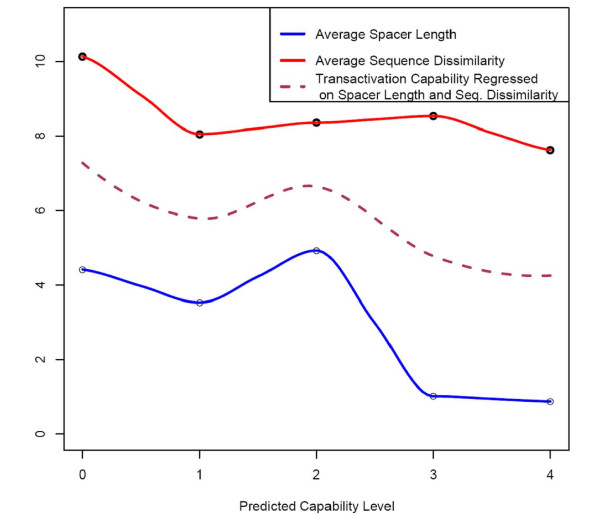
Figure 5.
Correspondence between predicted transactivation levels obtained from validated p53 REs with its dimer sequence dissimilarity and spacer lengths. Dimer sequence dissimilarity is calculated as the distance from the best p53 RE, (GGGCATGCCC)2. Also shown is a local regression curve fit on dimer dissimilarity and spacer length. All the three measurements are in general negatively correlated to the predicted transactivation scores.

