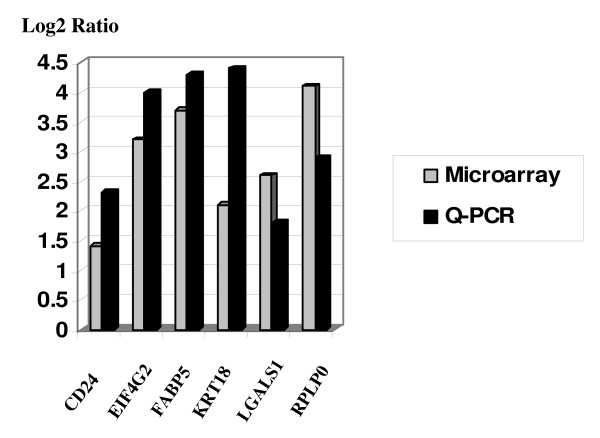
Figure 1.
Real-Time PCR confirmation of selected genes. The open bar represents expression ratio compared to huRNA control from microarray experiments, and solid bar presents the ratio from QRT-PCR experiments. Results indicate similar trend of gene expression in both microarray and QRT-PCR experiments.

