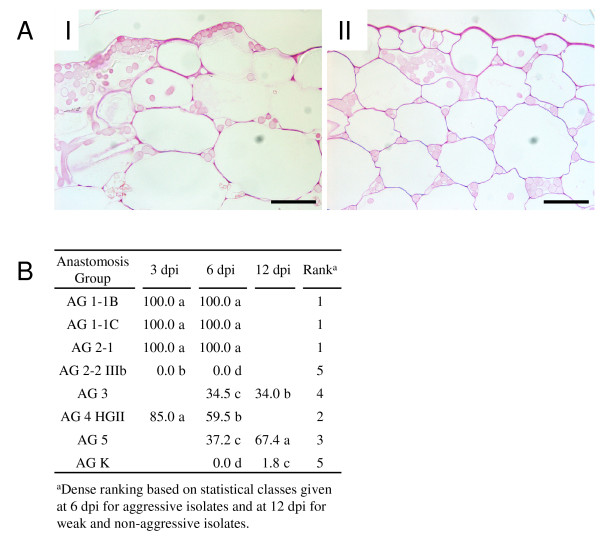
Figure 5.
Ruthenium red staining of cauliflower hypocotyl cells after infection by seven different R. solani AGs and one binucleate Rhizoctonia AG. A, Cellular responses were classified into two categories (I) Representative example of pectin breakdown as indicated by faint red colour. (II) Uniform red stain of the cell walls indicating absence of pectin breakdown as observed during the interaction with R. solani AG 2-2 IIIb. Scale bars = 50 μm. B, Relative proportion of interaction sites at which pectin degradation is observed at 3, 6 and 12 dpi during the interaction with different Rhizoctonia AGs. At each time point, at least 50 interaction sites per AG were studied originating from 10 different cauliflower hypocotyls. Within one column, values followed by the same letter are not significantly different according to Kruskal-Wallis and Mann-Whitney tests (α = 0.05).

