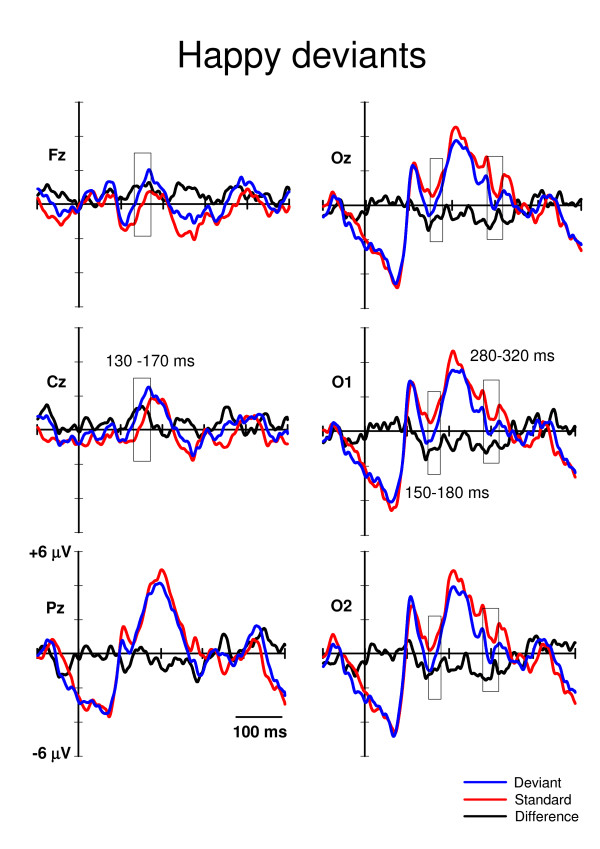
Figure 3.
Grand averaged ERPs to the happy deviants (blue lines) and the neutral standards (red lines) immediately preceding them. The difference ERPs (deviant minus standard) are drawn with the black lines. The time windows for extracting the mean values for the repeated measures MANOVA are marked with rectangles. The x-axis shows stimulus onset.

