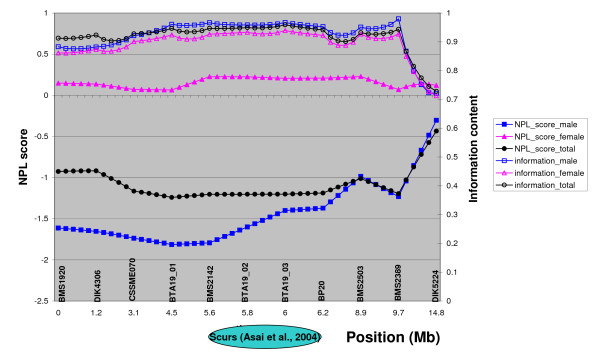
Figure 3.
Non-parametric linkage analyses of the 14.8 -cM interval of BTA19 studied. The upper three curves represent the information content for males, females and all progeny combined (Y-axis on the right) and the lower ones the non-parametric scores as calculated by GENEHUNTER for females, males and all progeny combined (Y-axis on the left). Also presented is the putative scurs locus according to Asai et al., 2004.

