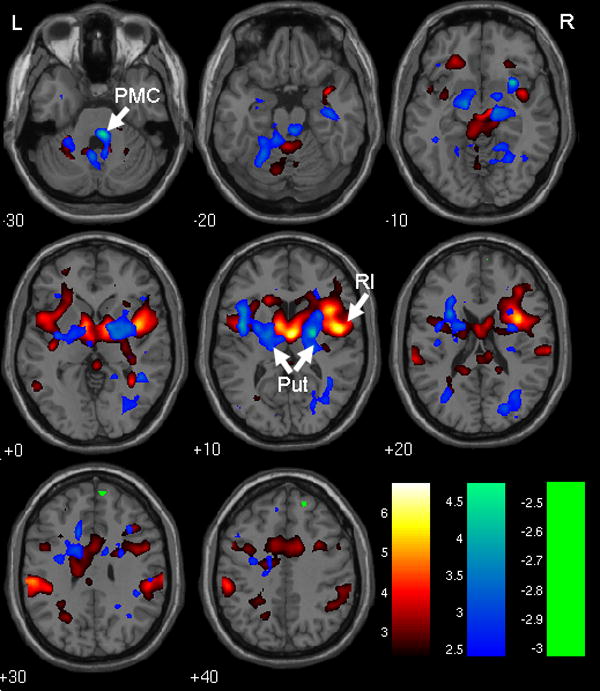
Figure 1.

Main effect of bladder filling and pattern of effective connectivity with RI and dACC. Red/yellow: regions responding to bladder filling with activation (see Table 1). Green: region responding to bladder filling with deactivation (see Table 1). Blue: regions where PhPI shows positive connectivity with RI and dACC (see Table 3). Color bars show how t-values are color coded. Note that blue obscures red/yellow where they overlap. RI = right insula, dACC = dorsal anterior cingulate cortex, Put = putamen, PMC = pontine micturition center. R = right, L = left, numbers show z-coordinate in mm.
