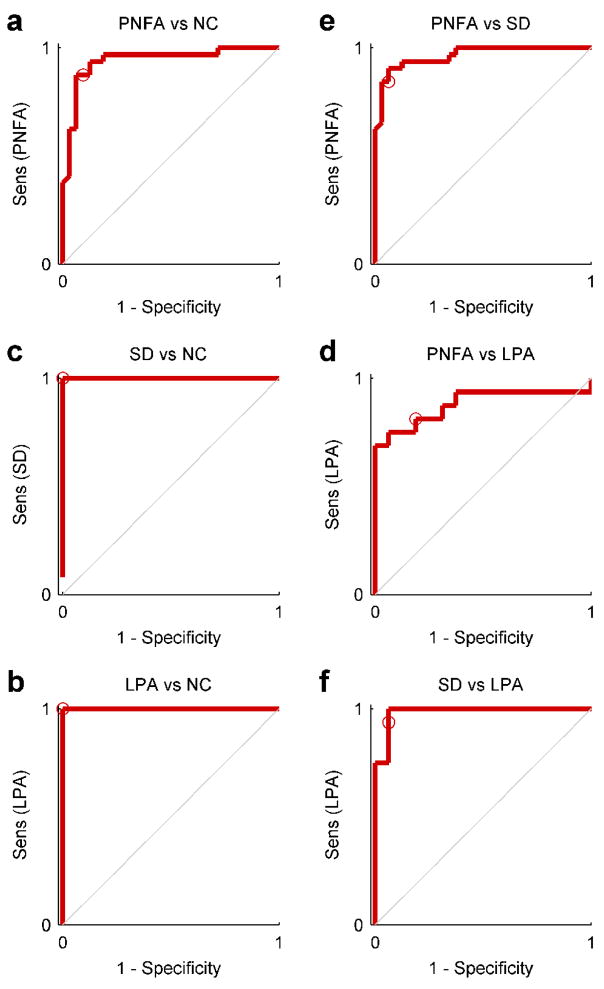
Figure 5.
ROC curves for each pair of groups: (a) PNFA vs NC; (b) SD vs NC; (c) LPA vs NC; (d) PNFA vs SD; (e) PNFA vs LPA; (f) SD vs LPA. These plots reveal tradeoffs between sensitivity and specificity. The ROC curve is plotted by varying the decision threshold for probability outputs between 0 and 1. The middle point of 0.5 used to quantify accuracy in Table 2 is denoted by a circle.

