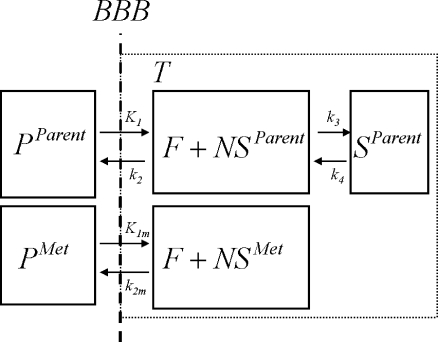
Fig. 1.
Schematic diagram of the model that includes a tissue metabolite compartment. BBB represents the blood–brain barrier; PParent and PMet are tracer plasma radioactivity concentrations (Bq ml−1) of parent and labeled metabolites, respectively; T is the radioactivity concentration in tissue, F+NSParent that of free and non-specifically bound parent in tissue, SParent that of bound parent in tissue; and F+NSMet that of labeled metabolites in tissue (Bq ml−1); K1 (ml·cm−3·min−1) and k2 (min−1) are rate constants, describing exchange of parent between plasma and tissue; k3 and k4 are rate constants (min−1), describing exchange of parent between free and bound compartments; K1m (ml·cm−3·min−1) and k2m (min−1) are rate constants, describing exchange of labeled metabolites between plasma and tissue.

