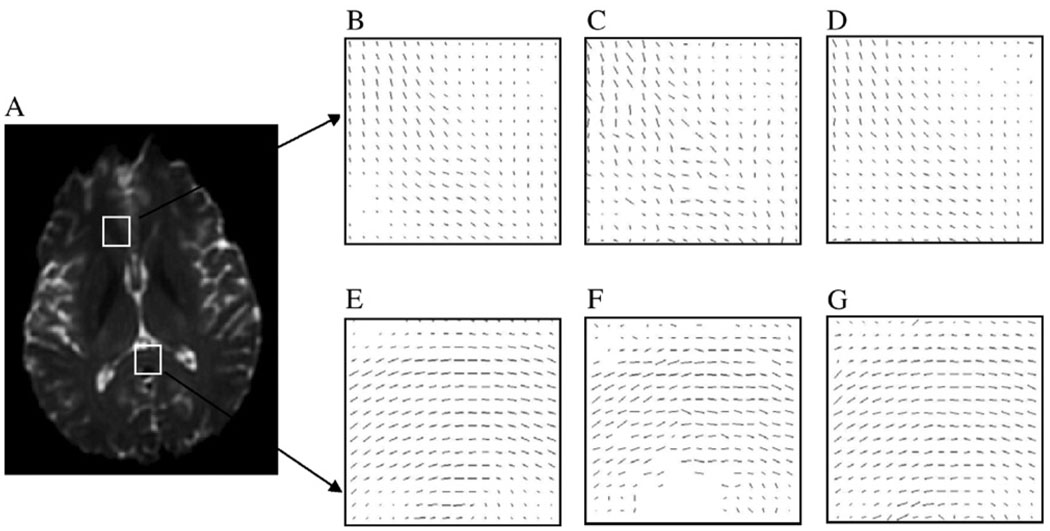
Fig. 2.
Demonstration of the effect of anisotropic smoothing on two selected regions in the human DTI data. (A) A T2-weighted image of a slice of the human brain. (B and E) In-plane component of PDDs in the boxed regions in Panel A. (C and F) PDDs after adding zero mean Gaussian noise (S.D. = 0.10) to the image data for the region in Panels B and E. (D and G) PDDs after 60 iterations of anisotropic smoothing.

