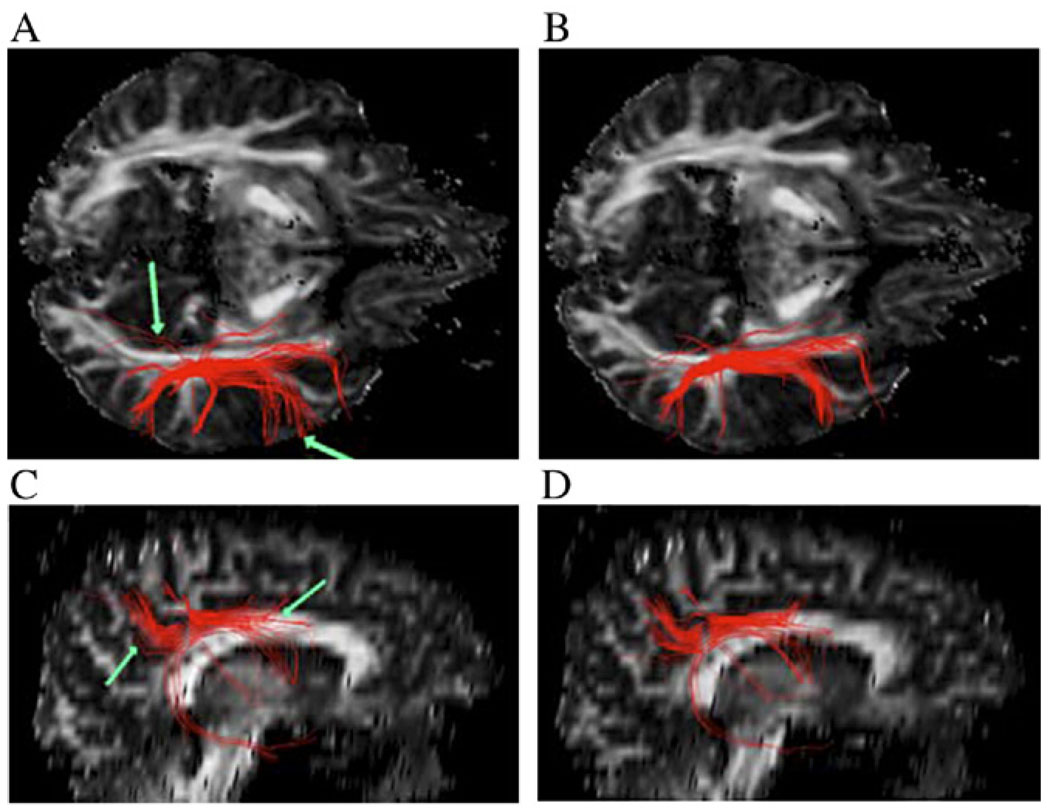
Fig. 8.
Axial (A and B) and sagittal (C and D) views of reconstructed fiber tracts seeded in the superior longitudinal fasciculus from the original high-quality data. The left column (A and C) shows the fibers using the Euler method (linear interpolation), and the right column (B and D) shows fibers using the Bayesian method (anisotropic interpolation). Green arrows point to erroneous pathways using the Euler method.

