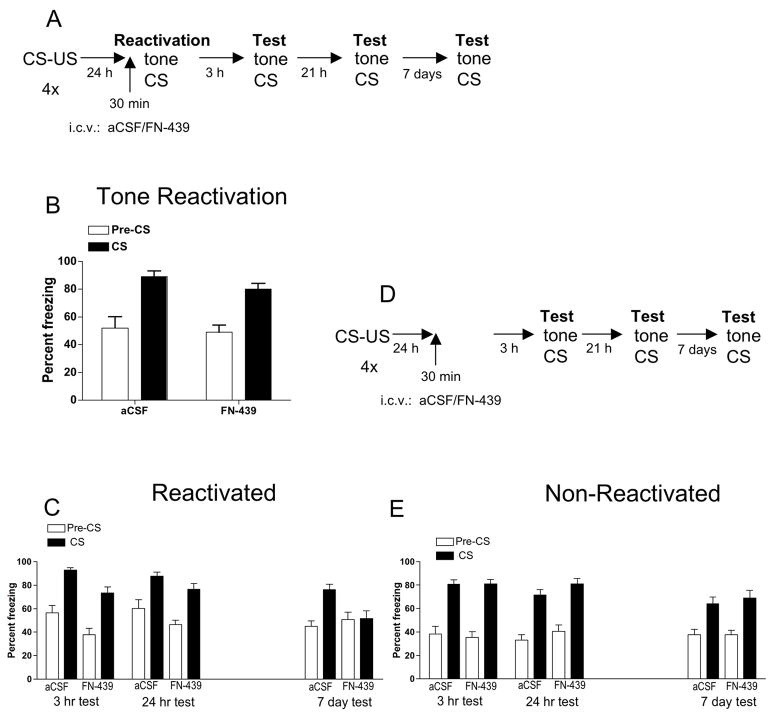
Figure 2. MMP inhibition with FN-439 treatment prior to tone reactivation in the freeze monitoring chamber blocks freezing in response to the tone CS 7 days later.
(A) Experimental timeline for rats given the tone CS reactivation session. (B) Tone reactivation session. Data are mean ± SEM of percent freezing. Percent freezing = percent freezing in the absence of tone presentation (Pre-CS) followed by percent freezing in the presence of tone presentation (CS). Injection of aCSF or FN-439 was given 30 min prior to the tone reactivation session in the freeze monitoring chamber (test chamber). Both the aCSF group and FN-439 group showed a significant elevation in freezing when the tone CS was present compared to the pre-CS period, with no difference in freezing between the two treatment groups. N = 11 for aCSF group; N = 10 for FN-439 group. (C) Test in reactivated animals shown in 2B when assessed 3 hr, 24 hr and 7 day later for freezing response to the tone CS. Rats given FN-439 during the reactivation session did not demonstrate increased freezing to the CS on the 7 day test. (D) Experimental timeline for non-reactivation control groups. Rats were given identical treatment as shown in the Figure 2A protocol, but on the day of reactivation, animals were placed into the test chamber for 6 min with no tone CS presentation. (E) Non-reactivation control groups. Data are mean ± SEM of percent freezing. Rats were tested 3 hr, 24 hr and 7 day later. There were no differences in freezing between treatment groups at any of the time points. N = 16 for aCSF group; N = 15 for FN-439 group.

