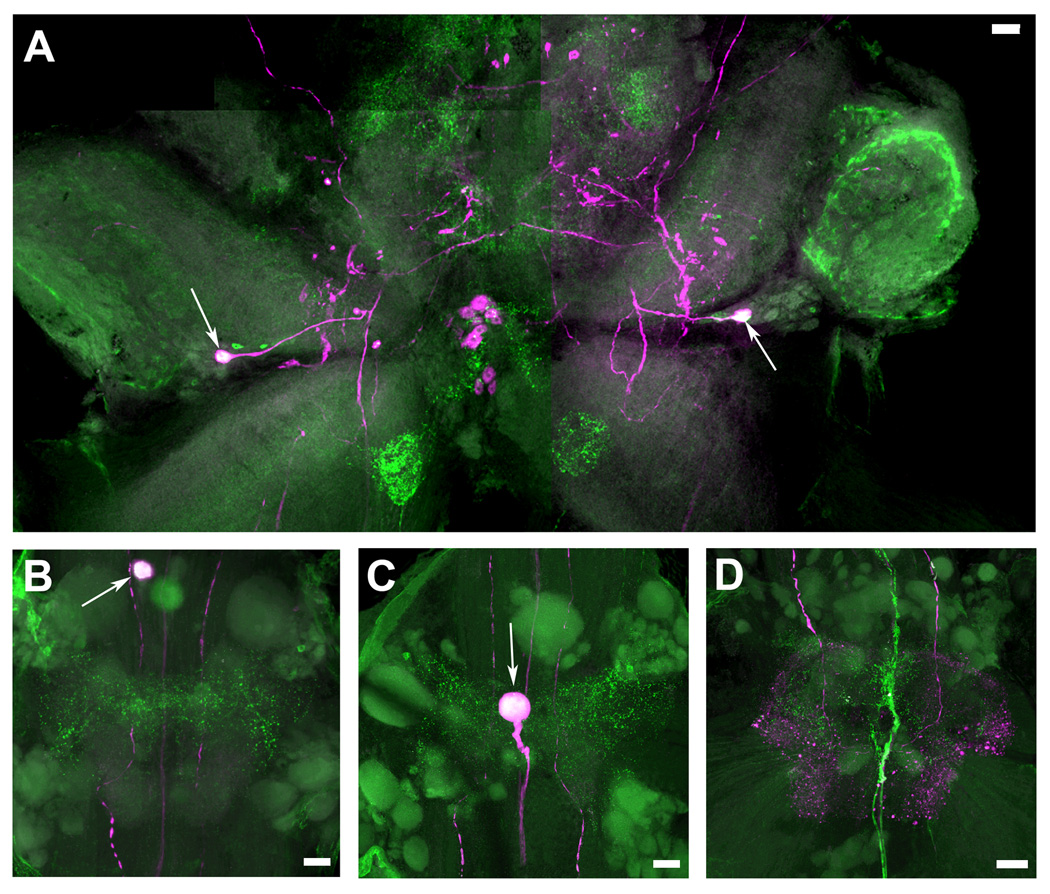
Figure 9. Colocalization of 5-HT2Mac and TH immunoreactivity in the CNS of the prawn.
5-HT2Mac immunoreactivity (ir) shown in green and Tyrosine Hydroxylase (TH) ir shown in magenta. TH ir is taken to represent dopamine (DA)-containing cells (see Materials & Methods). Cells and fibers showing immunoreactivity to both 5-HT2Mac and TH appear white. A: View of the brain, showing colocalization of both 5-HT2Mac and TH/DA only in the somas of a pair of medium-sized cells in the deutocerebrum (white arrows). B: View of the first abdominal ganglion (A1) showing colocalization of both 5-HT2Mac and TH/DA only at the soma of a single cell located at the midline (white arrow). C: View of the third abdominal ganglion (A3) showing colocalization of both 5-HT2Mac and TH/DA only at the soma of a single cell located at the midline (white arrows. D: View of the sixth abdominal ganglion (A6) showing there is no colocalization of 5-HT2Mac and DA (no white or overlapping staining). All images shown were obtained from the ventral nerve cord of a male blue clawed prawn. All images are composites of optical slices of sets of confocal stacks spanning the full dorsal-ventral axis of the ganglia. The fluorescence has been digitally brightened, and several pieces of surface debris have been digitally removed. (Scale bars = 100 µm).

