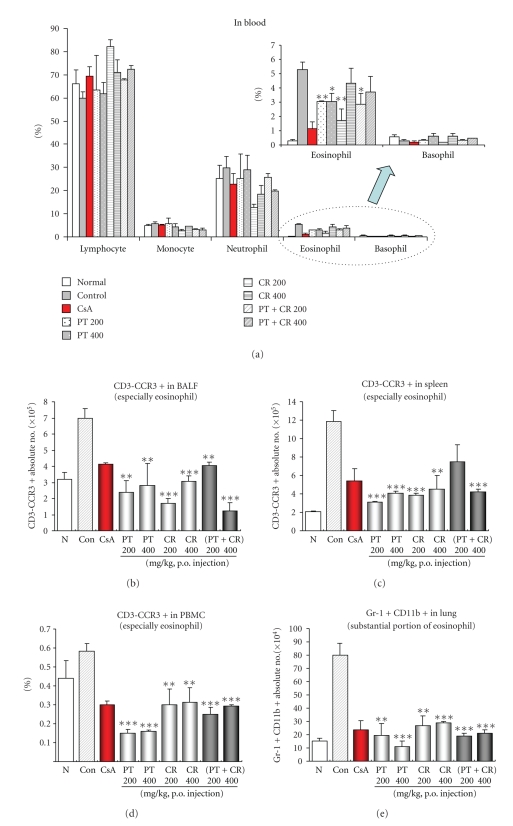
Figure 3.
Quantification by means of FACS analysis of CD3-CCR3+ cell subtypes in BALF, spleen, lung, and PBMC. Absolute number of CD3-CCR3+ cell subtypes in BALF, spleen, lung and PBMC were counted (seen materials and methods). The results are expressed the mean ± S.E (N = 5). Statistically significant value compared with control group data by ANOVA or unpaired Student's t-test (*P < .05, **P < .01, ***P < .001). N: Normal Balb/c mice, CT: Ovalbumin inhalation (control group), CsA: OVA + CsA (10 mg/kg), OVA + PT(200, 400 mg/kg), OVA + CR(200, 400 mg/kg), OVA + (PT + CR) (200, 400 mg/kg).

