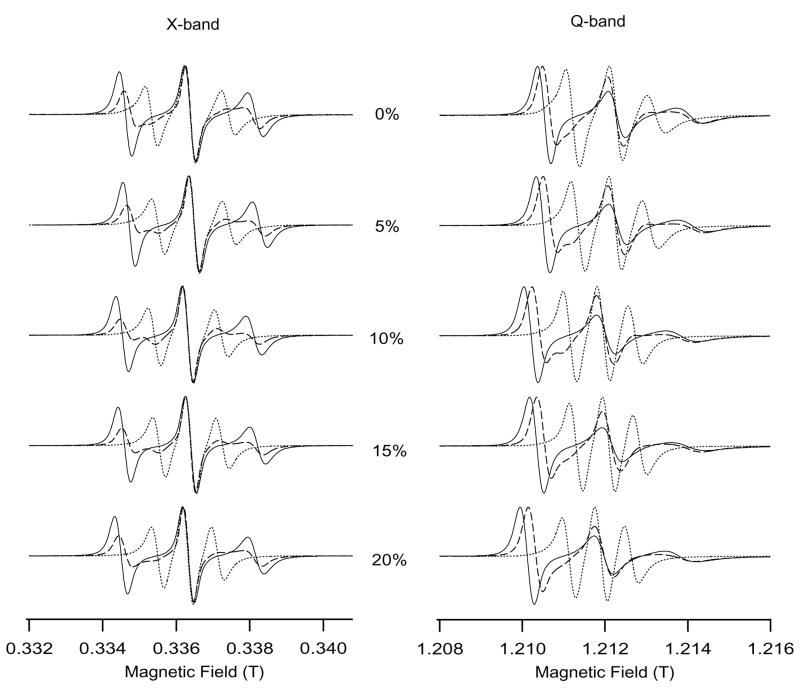
Figure 1.
A comparison between X-band and Q-band EPR spectra of cholestane incorporated into magnetically aligned bicelles at 318 K as a function of cholesterol mol% (0,5,10,15,20) with respect to DMPC. For the superimposed EPR spectra, the dashed line represents the randomly dispersed spectra (without lanthanides), solid line represents the Dy3+-doped perpendicular-aligned spectra and the dotted line shows the Tm3+-doped parallel-aligned spectra with respect to the static magnetic field.

