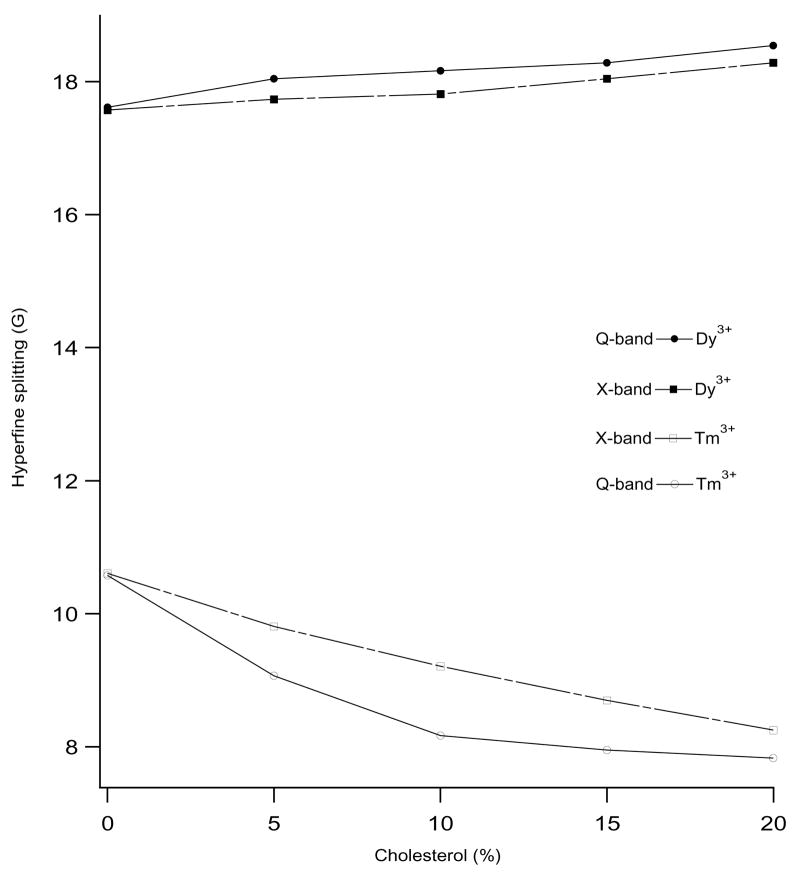
Figure 2.
Diagram showing the dependence of hyperfine splitting values on the concentration of cholesterol in the DMPC/DHPC phospholipids bilayers at 318 K. The filled circles and squares represent the hyperfine splitting values of Dy3+-doped perpendicular aligned bicelles spectra and open circles and squares represent the hyperfine splitting values of Tm3+-doped parallel aligned bicelles spectra. The solid lines and broken lines represent the hyperfine splitting values measured at Q-band and X-band, respectively.

