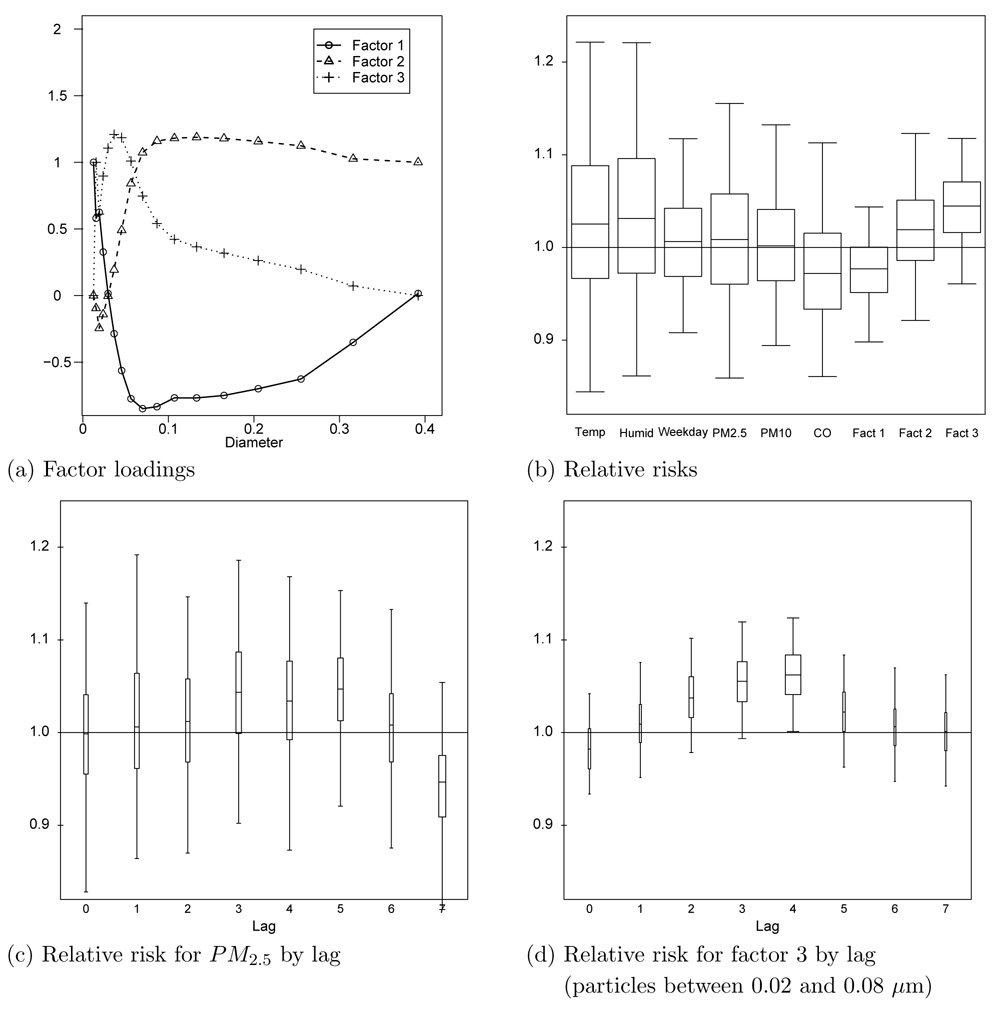
Figure 4.
Summary of the analysis of the effects of ambient pollution levels on non-accidental mortality. Panel (a) shows the posterior medians of the factor loadings. Panel (b) shows the posteriors of the relative risks of the predictors of mortality. The whiskers of the boxplots represent 95% intervals and the relative risks represent a one standard deviation increase. Panels (c) and (d) plot the relative risk associated with PM2.5 and factor 3 for each lag. The width of the boxplots are proportional to the posterior probability of the lag.

