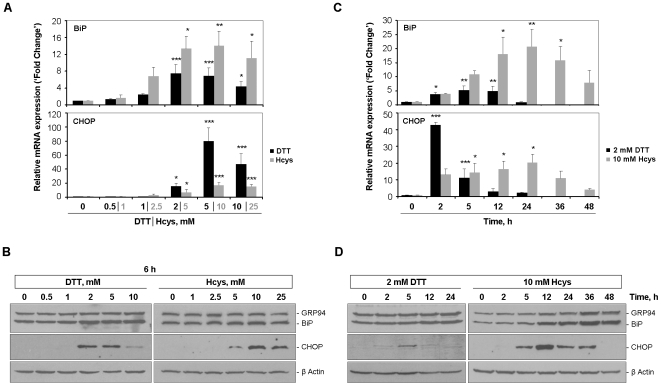
Figure 1. Monitoring of UPR activation markers in HepG2 cells during the DTT- and Hcys-induced ER-stress.
Dose-response assays (A and B): HepG2 cells were incubated for 6 h with increasing concentrations of DTT or Hcys, as indicated. Control cells received vehicle alone. Time-course assays (C and D): HepG2 cells were exposed to 2 mM DTT or 10 mM Hcys for the indicated times. Control cells were left untreated. A and C, BiP and CHOP mRNA levels were assessed by real-time RT-PCR and normalized to GAPDH expression. Results are expressed as fold change over control-treated cells and represent the average+SD of three independent experiments. B and D, GRP94, BiP (using an anti-KDEL antibody) and CHOP were measured by western blot in whole cell lysates of HepG2 cells. As loading control, membranes were stripped and reprobed for β-actin. Representative blots of three independent experiments are shown. *p<0.05, **p<0.01, ***p<0.001 vs control.

