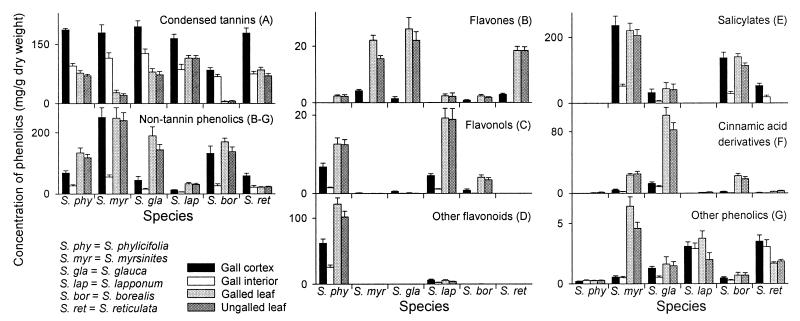
Figure 1.
Mean (+1 SE) total concentrations for different categories of phenolic compounds in the 24 sample classes. Letters in parentheses refer to the chemical categories in Fig. 4 and Table 1 in Supplementary Material (www.pnas.org). Repeated-measures analyses of variance on the totals show that the effect of sample, species, and their interaction, are statistically highly significant in all chemical categories (Table 3 in Supplementary Material).

