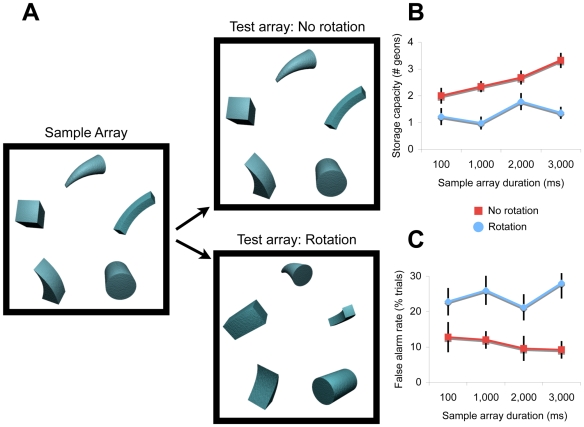
Figure 2. Design and Results from Experiment 1.
(A) Observers viewed a sample array and a test array on each trial, separated by a 1,000-ms delay interval, and then indicated whether the same objects were present in both arrays. In separate conditions, the sample arrays were displayed for 100 ms, 1,000 ms, 2,000 ms, and 3,000 ms. In the ‘no rotation’ condition, the objects were presented from the same viewpoints in the sample and test arrays; in the ‘rotation’ condition, the objects were presented from different viewpoints in the arrays (45° or 90° rotation). (B) The storage capacity of visual working memory for non-rotated and rotated objects as a function of the display time of the sample arrays. Error bars represent standard error. (C) Percentage of false alarms for non-rotated and rotated objects as a function of the display time of the sample arrays. Error bars represent standard error.

