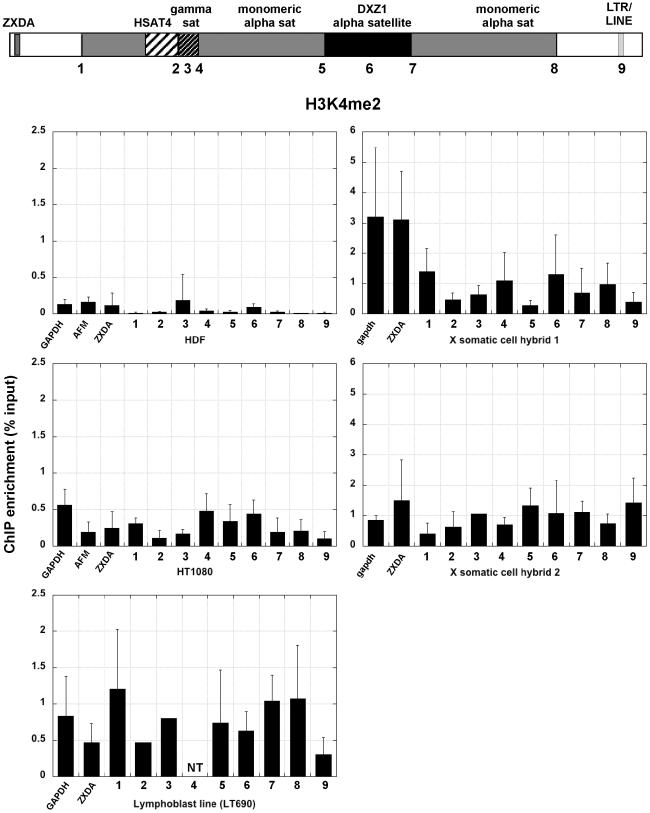
Figure 2. H3K4me2 across the X centromere in primary and immortalized human cells and two mouse-human hybrids containing X as the only human chromosome.
The schematic at the top of the figure shows the structure of the X centromere. Each number along the centromere represents a genomic site that was interrogated by ChIP-PCR with a specific histone antibody. Each bar graph shows relative enrichment for each histone modification (n≥3 with standard deviation, SD). Control regions, including GAPDH, AFM and X-linked ZXDA are also included. The bar graph shows enrichment calculated as percentage of input.

