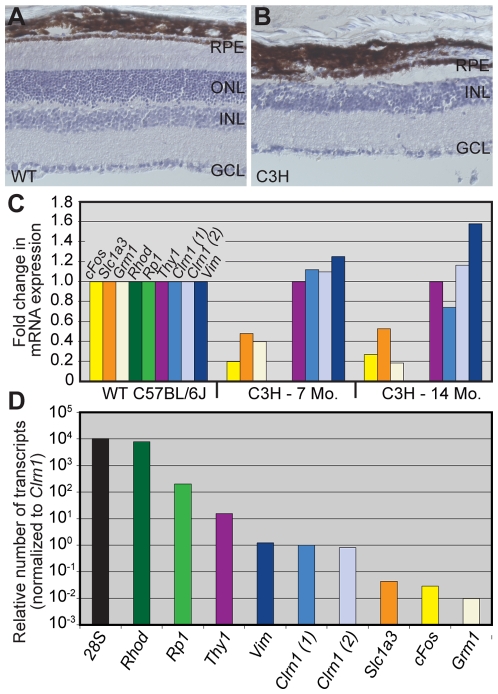
Figure 4. Analysis of Clrn1 in WT and photoreceptorless C3H/HeJ aged mouse retinas.
(A,B) Sixteen micron cryosections of WT (A) and degenerated C3H (B) mouse retinas counterstained with hematoxylin. Note the virtual complete loss of photoreceptors in the 14 month C3H retina. (C) Real-time quantitative (q) RT–PCR was performed in order to correct for the RNA contribution of the outer retina in the WT cDNA sample. The data were normalized to the ganglion cell marker Thy1, and subsequently to expression levels in the WT sample. For comparison purposes, several additional known retinal transcripts were included in the qRT–PCR analysis. (D) Relative transcript expression levels in retinas from WT and photoreceptorless animals. Normalizing to a Clrn1 primer pair, the range in the abundance of non-Clrn1 transcripts was 100-fold fewer (Grm1) to 10,000-fold higher (Rhod). Scale bar = 50 µm in all images. ONL = outer nuclear layer, INL = inner nuclear layer, and GCL = ganglion cell layer.

