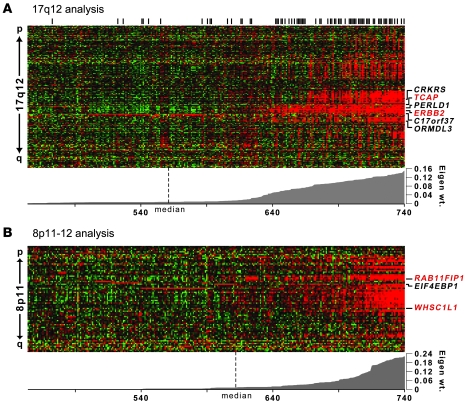
Figure 1. Graphical view of TRIAGE analysis of 17q12 and 8p11–12 amplicons.
Expression heat maps of the AEFs at (A) 17q12 and (B) 8p11–12 are shown. Tumors are arranged in columns, and genes identified by LSVD are organized in rows (in chromosomal order). Red color indicates above-mean gene expression; green denotes below-mean expression. Tumors are ranked by the absolute value of the eigenweight (shown below heat map). Genes with significant survival associations at TRIAGE step 3 are shown to the right. Genes in red indicate top oncogene candidates by TRIAGE (see Table 2). Black vertical bars above the heat map in A denote ERBB2 (HER2/neu) positivity by immunohistochemistry.

