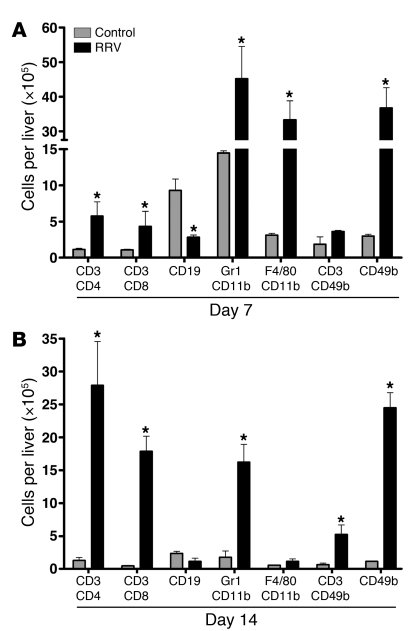
Figure 2. Population of neonatal livers by inflammatory cells after RRV challenge.
Flow cytometry–based quantification of hepatic mononuclear cells at 7 (A) and 14 (B) days after RRV or saline inoculation into 1-day-old mice. The vertical axes show the average number of cells per liver ± SD. n = 3–4 for each group and time point for all experiments; *P < 0.05, RRV versus saline (control) groups. The horizontal axes show the surface markers identifying specific cell types.

