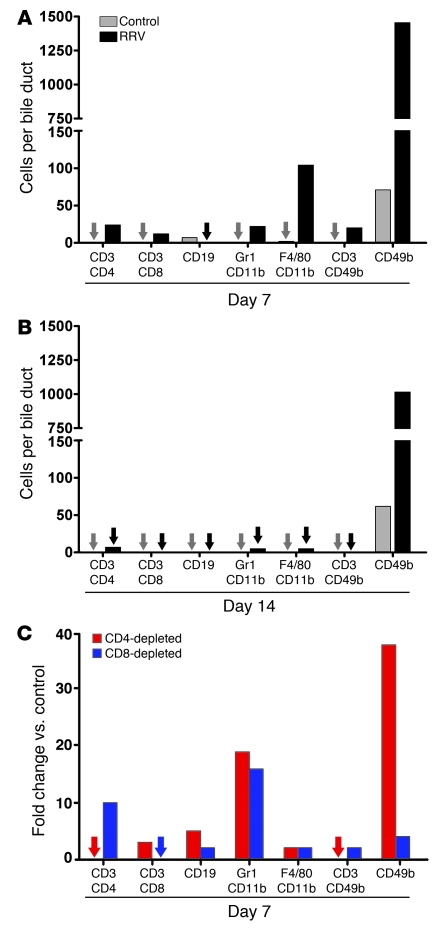
Figure 4. Population of the neonatal extrahepatic biliary tract by inflammatory cells after RRV challenge.
Flow cytometric quantification of mononuclear cells isolated from extrahepatic bile ducts/gallbladders microdissected en bloc at 7 (A) and 14 (B) days after saline or RRV injection into 1-day-old mice. The vertical axis shows the average number of cells per bile duct. (C) The number of cells per bile duct is shown as fold changes in RRV-inoculated relative to saline-control mice that had been depleted of CD4+ or CD8+ cells (cells isolated at 7 days after injection of saline or RRV). n = 15–20 mice per group and per time point for all experiments; arrows indicate nondetectable cells. The horizontal axis shows the surface markers identifying specific cell types.

