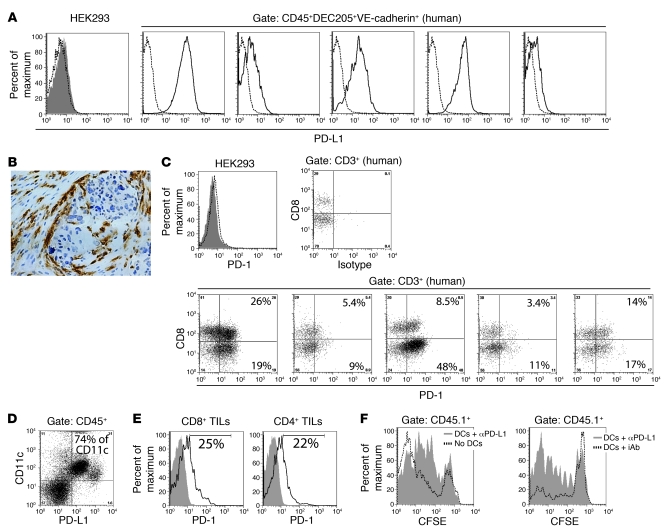
Figure 6. PD-L1 on ovarian cancer–associated DCs inhibits antigen-specific T cell responses.
(A) FACS analysis of PD-L1 expression on HEK293 cells (negative control) or CD45+DEC205+VE-cadherin+ DCs infiltrating 5 unselected dissociated stage III human tumors. Dotted histograms represent isotype control staining. (B) Representative immunohistochemistry of PD-L1+ cells surrounding a tumor islet in a human ovarian carcinoma specimen. Original magnification, ×200. (C) PD-1 expression on control HEK293 cells and tumor-infiltrating lymphocytes (TILs) matching the human specimens in A. Dotted histogram represents isotype control staining; filled histogram demonstrates negative PD-1 staining. The percentage of human tumor-infiltrating T cells that express PD-1 is indicated. (D) PD-L1 expression by peritoneal tumor DCs in mice bearing advanced ID8-Defb29/Vegf-A ovarian carcinoma. The percentage of CD11c+ cells coexpressing PD-L1 is indicated. (E) Representative FACS analysis of PD-1 expression by T cells infiltrating mouse ID8-Defb29/Vegf-A ovarian tumors. Filled histograms indicate isotype control; open histograms show PD-1 staining. The percentage of mouse tumor-infiltrating T cells expressing PD-1 is indicated. (F) Representative FACS analyses of mice transferred with PD-L1–blocked DCs compared with both a mouse that did not receive DCs (left) and a mouse transferred with DCs incubated with corresponding isotype control antibodies (iAb; right).

