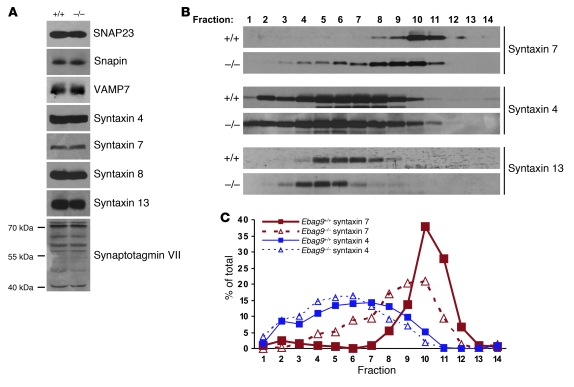
Figure 11. Redistribution of the endosomal vesicle marker syntaxin 7.
(A) Identical expression levels of SNARE and SNARE-associated proteins in WT and EBAG9-deficient CTLs. Equal amounts of CD8+ T cell extracts were analyzed by SDS-PAGE, followed by immunoblotting with the indicated antibodies. Synaptotagmin VII occurred in several splice variants. One representative experiment of 9 animals analyzed (per group) is shown. (B) A postnuclear supernatant from 8 × 10⁷ to 1 × 10⁸ Ebag9+/+ or Ebag9–/– CTLs (day 6–7) was centrifuged at 100,000 g for 45 minutes to obtain a microsomal fraction. Microsomes were further resolved on a continuous OptiPrep gradient. Fractions (0.75 ml) were collected from the top of each gradient, and proteins were precipitated with TCA. Samples were resolved by SDS-PAGE and analyzed by immunoblot using polyclonal antibodies as indicated. Data are representative of 3 experiments performed, with pooled CTLs from 9 mice per group. (C) Protein marker distribution was quantified by densitometric scanning and expressed as percentage of the total amount present in the microsomal pellet.

